
I figured what was going on with the inaccurate scatter plot from the Chart Builder. For some reason, the variables were being treated as Nominal, despite the variable view showing them as Scale!
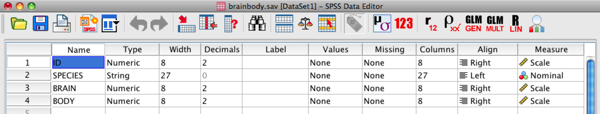
This may be an artifact of an import from SAS, but the Legacy Dialogs and Descriptives treat both variables as if they are Scale. Even though, I was able to get a correct graph by changing the variables to Nominal and back to Scale, I am left just as befuddled how this even happened in the first place. It seems that you may be better off using Excel (or Numbers!) for graphing.
This error really calls into question most analyses I (and others) run in SPSS. Considering that much of the published research in psychology relies on the accuracy of SPSS in reporting statistics, I am very concerned.
Moral of the story: Use SAS or R. Unfortunately, I can't use SAS (it hasn't had a Mac version since OS 9). Maybe it is high time to give R a serious look, but the lack of GUI makes for a huge learning curve.